Business Requirement: Total Revenue Validation
Total Revenue
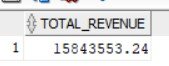
SELECT SUM(price + freight_value) AS total_revenue
FROM order_items;
SQL Output:
Power BI Output:
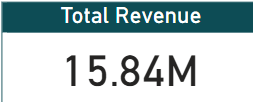
SELECT SUM(price + freight_value) AS total_revenue
FROM order_items;
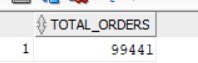
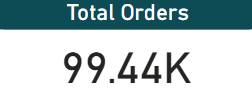
select count(distinct(order_id)) as Total_Orders from orders;
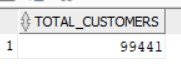
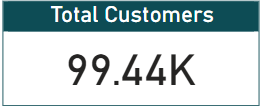
select count(distinct(customer_id)) as Total_Customers from customers;
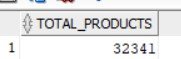
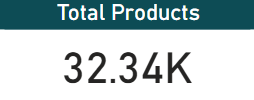
select count(distinct(product_id)) as Total_Products from products;
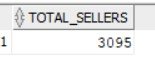
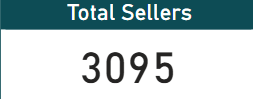
select count(distinct(seller_id)) as Total_Sellers from sellers;
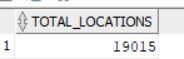
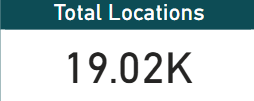
select count(distinct(GEOLOCATION_ZIP_CODE_PREFIX)) as Total_locations from geo_location;
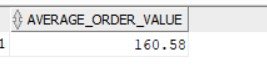
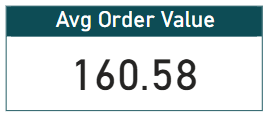
SELECT Round(Sum(price + freight_value) / Count(DISTINCT( order_id )), 2) AS
       Average_order_value
FROM   order_items;
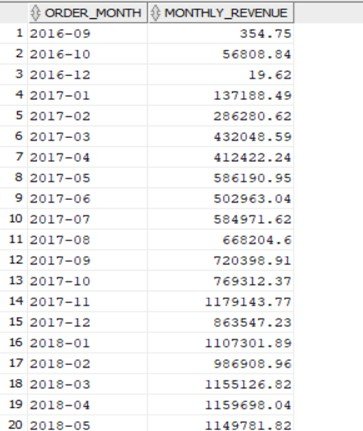
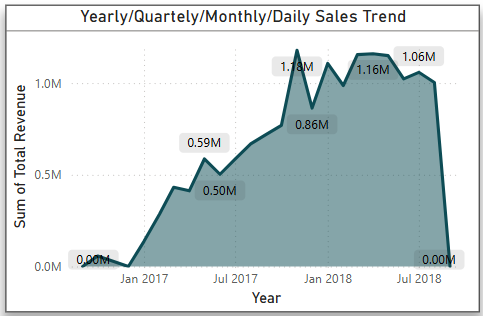
SELECT
    TO_CHAR(o.order_purchase_ts, 'YYYY-MM') AS order_month,
    ROUND(SUM(oi.price + oi.freight_value), 2) AS monthly_revenue
FROM orders o
JOIN order_items oi ON o.order_id = oi.order_id
GROUP BY TO_CHAR(o.order_purchase_ts, 'YYYY-MM')
ORDER BY order_month;
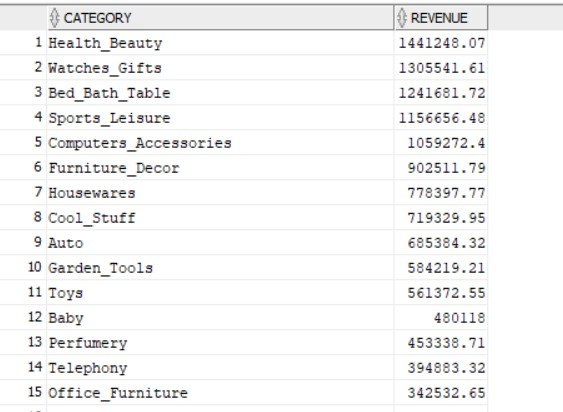
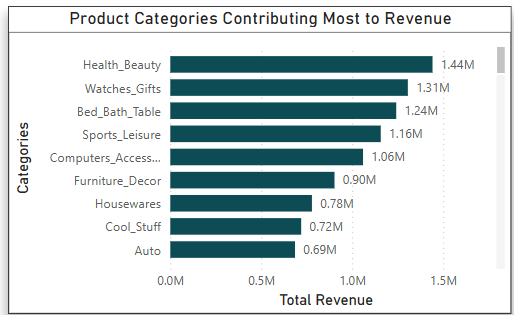
select p.PRODUCT_CATEGORY_NAME as Category, sum(oi.price + oi.freight_value) as Revenue
from products p join order_items oi
ON p.product_id =oi.product_id
group by p.PRODUCT_CATEGORY_NAME
order by revenue desc;
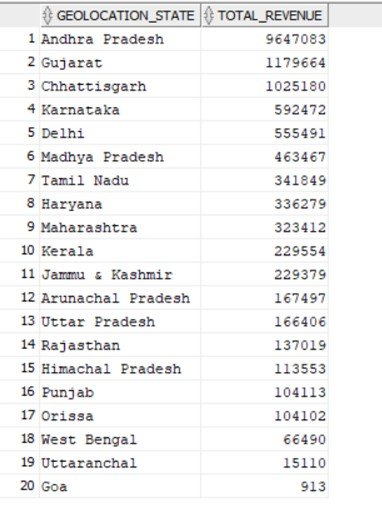
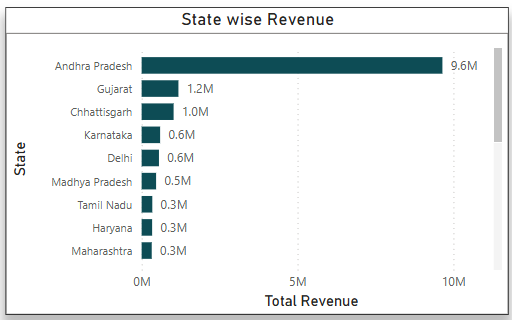
SELECT
    g.GEOLOCATION_STATE,
    ROUND(SUM(oi.price + oi.freight_value)) AS total_revenue
FROM orders o
JOIN order_items oi ON o.order_id = oi.order_id
JOIN customers c ON o.customer_id = c.customer_id
JOIN geo_location g ON c.customer_zip_code_prefix = g.geolocation_zip_code_prefix
GROUP BY g.GEOLOCATION_STATE
ORDER BY total_revenue DESC;
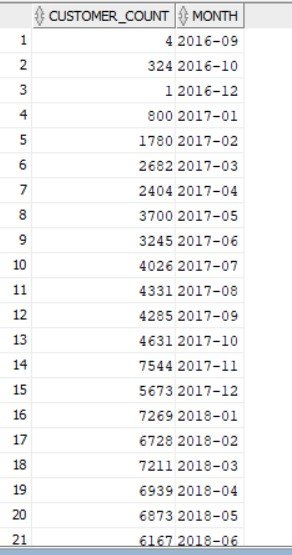
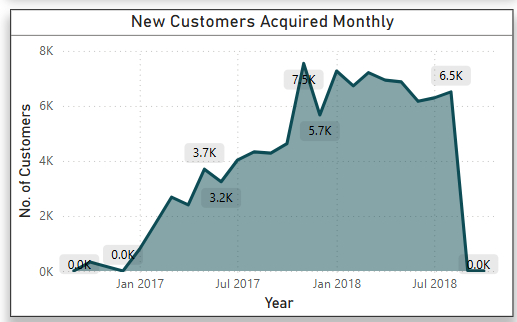
select count(distinct(customer_id)) as customer_count, TO_CHAR(ORDER_PURCHASE_TS, 'YYYY-MM') as Month from orders
group by TO_CHAR(ORDER_PURCHASE_TS, 'YYYY-MM')
order by month;
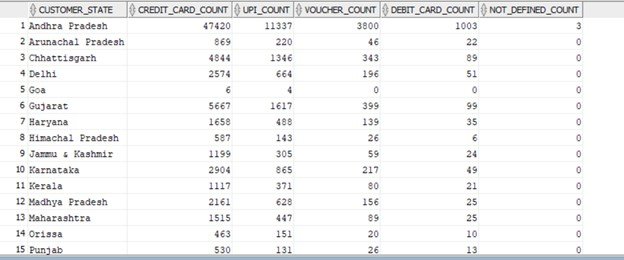
SELECT
    c.customer_state,
    COUNT(CASE WHEN op.payment_type = 'credit_card' THEN 1 END) AS credit_card_count,
    COUNT(CASE WHEN op.payment_type = 'UPI' THEN 1 END) AS upi_count,
    COUNT(CASE WHEN op.payment_type = 'voucher' THEN 1 END) AS voucher_count,
    COUNT(CASE WHEN op.payment_type = 'debit_card' THEN 1 END) AS debit_card_count,
    COUNT(CASE WHEN op.payment_type = 'not_defined' THEN 1 END) AS not_defined_count
FROM customers c
JOIN orders o
    ON c.customer_id = o.customer_id
JOIN order_payments op
    ON op.order_id = o.order_id
GROUP BY  c.customer_state
ORDER BY c.customer_state;
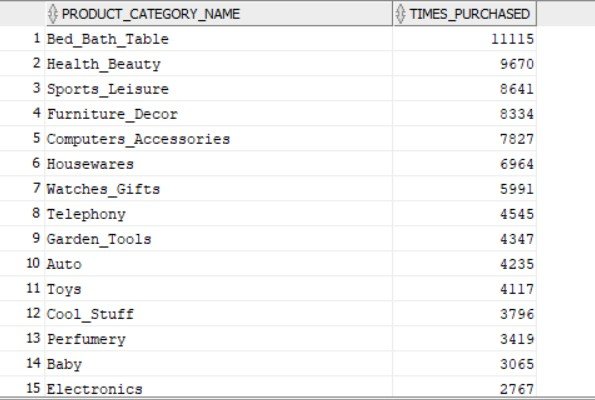
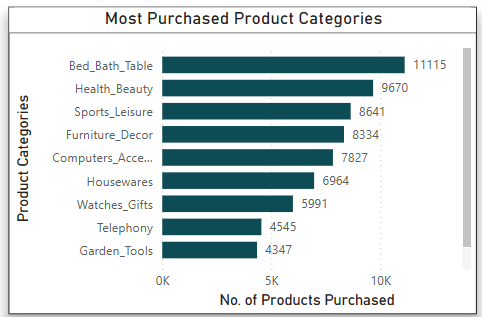
select p.product_category_name, count(oi.order_item_id) as times_purchased
from products p
join order_items oi on p.product_id = oi.product_id
group by p.product_category_name
order by times_purchased desc;
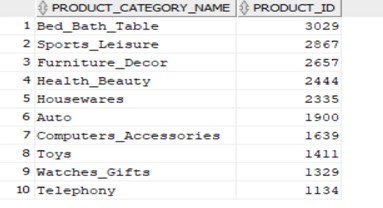
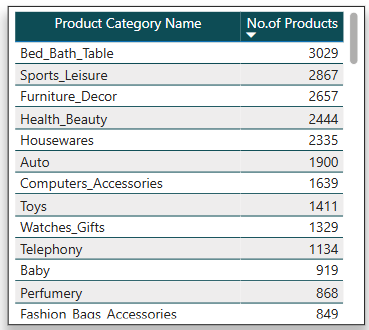
select  product_category_name, count(product_id) as product_id from products
group by product_category_name
order by product_id desc
fetch first 10 rows only;
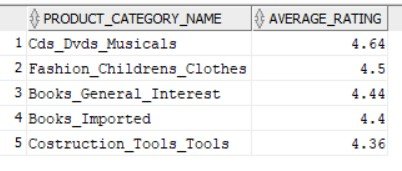
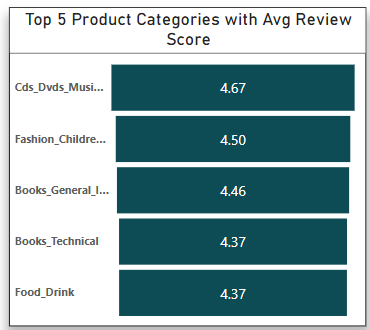
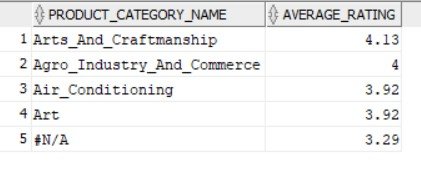
select p.PRODUCT_CATEGORY_NAME, round(avg(ore.review_score),2) as Average_Rating from order_items oi
join order_reviews ore on oi.order_id = ore.order_id
join products p on p.product_id = oi.product_id
group by p.PRODUCT_CATEGORY_NAME
order by Average_Rating Desc
fetch first 5 rows only;
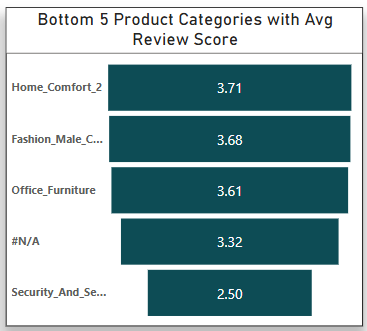
select * from (
select p.PRODUCT_CATEGORY_NAME, round(avg(ore.review_score),2) as Average_Rating from order_items oi
join order_reviews ore on oi.order_id = ore.order_id
join products p on p.product_id = oi.product_id
group by p.PRODUCT_CATEGORY_NAME)
WHERE ROWNUM <= 5
order by Average_Rating desc;
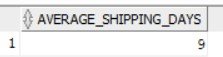
select round(avg((ORDER_DELIVERED_CARRIER_DT) - (ORDER_PURCHASE_TS))) as Average_Shipping_Days from orders;
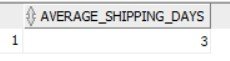
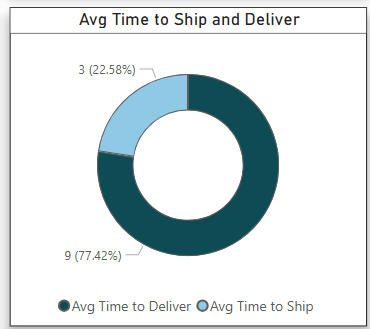
select round(avg((ORDER_DELIVERED_CUSTOMER_DT) - (ORDER_DELIVERED_CARRIER_DT))) as Average_Shipping_Days from orders;
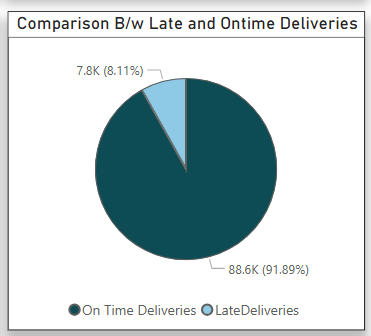
select ( 100 - (Order_Delay)) as On_time_orders, Order_Delay from (
    select round((count( case when ORDER_DELIVERED_CUSTOMER_DT > ORDER_ESTIMATED_DELIVERY_DT then 1 end) *100)/count(order_id),2) as Order_Delay  from orders
    where ORDER_DELIVERED_CARRIER_DT is not null and ORDER_DELIVERED_CUSTOMER_DT is not null);
.jpg)
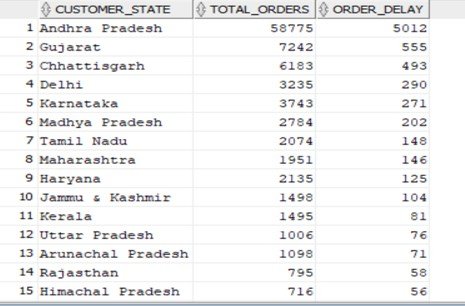
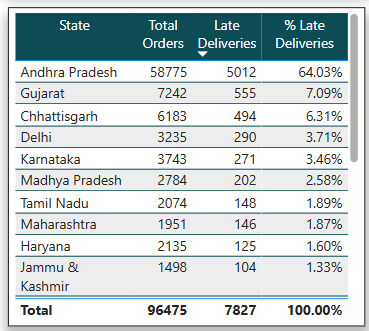
select c.customer_state, count(o.order_id) as Total_orders,count( case when o.ORDER_DELIVERED_CUSTOMER_DT > o.ORDER_ESTIMATED_DELIVERY_DT then 1 end) as Order_Delay
from customers c join orders o on c.customer_id = o.customer_id
where ORDER_DELIVERED_CARRIER_DT is not null and ORDER_DELIVERED_CUSTOMER_DT is not null
group by c.customer_state
order by order_delay desc;
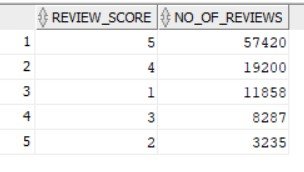
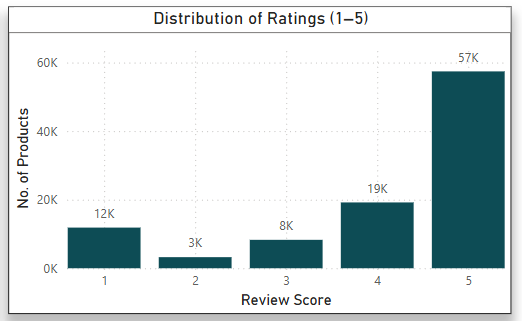
select review_score,count(review_score) as no_of_reviews from order_reviews
group by review_score
order by no_of_reviews desc;
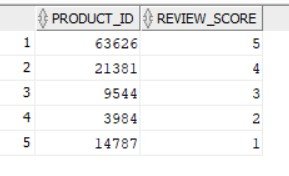
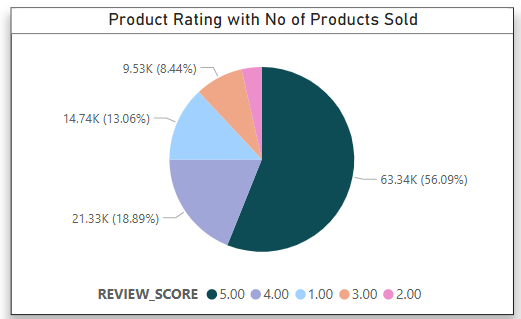
select count(oi.product_id) as product_id , ore.review_score from order_items oi join order_reviews ore on oi.order_id =ore.order_id
group by review_score
order by review_score desc;
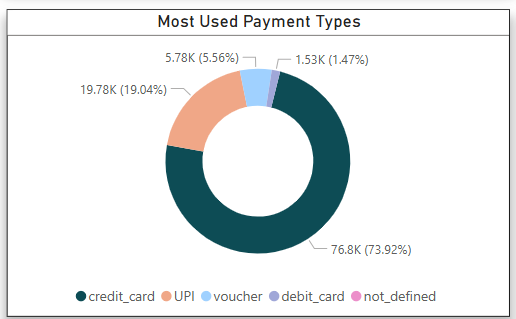
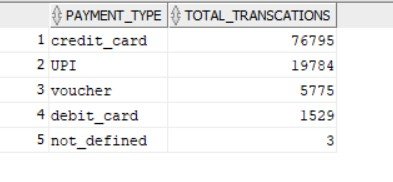
select payment_type, count(payment_type) as Total_transcations from order_payments
group by payment_type
order by Total_transcations desc;
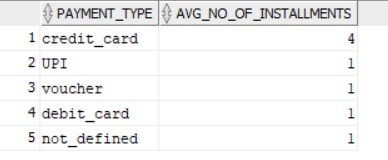
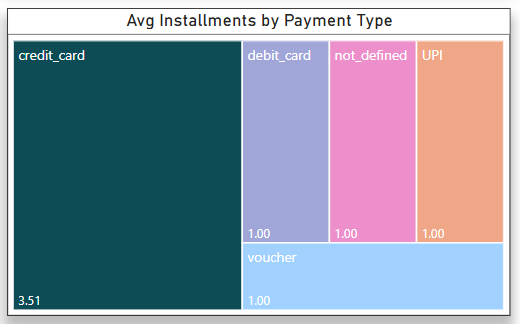
select payment_type, round(avg(PAYMENT_INSTALLMENTS)) as Avg_no_of_installments from order_payments
group by payment_type;