📊 Marketing Campaign Performance Analysis
📌 Objective
To evaluate and optimize Facebook and Google AdWords marketing campaigns using Python and Power BI, aiming to improve conversions and reduce cost per acquisition.
🛠 Tools Used
- Python (Pandas, Matplotlib, Seaborn)
- Power BI (for dashboard visualizations)
- Jupyter Notebook
📂 Dataset Overview
Daily-level ad campaign data covering 1 year for both Facebook and Google AdWords. Key features include:
- Views, Clicks, Conversions, Spend
- Derived metrics: CTR, CPC, Conversion Rate, Cost per Conversion
❓ Business Questions
- Which platform performs better in terms of CTR and conversion rate?
- What are the monthly trends in cost-efficiency?
- Do higher costs result in more conversions?
- Which campaigns offer the best ROI?
📊 Key Insights (Summary)
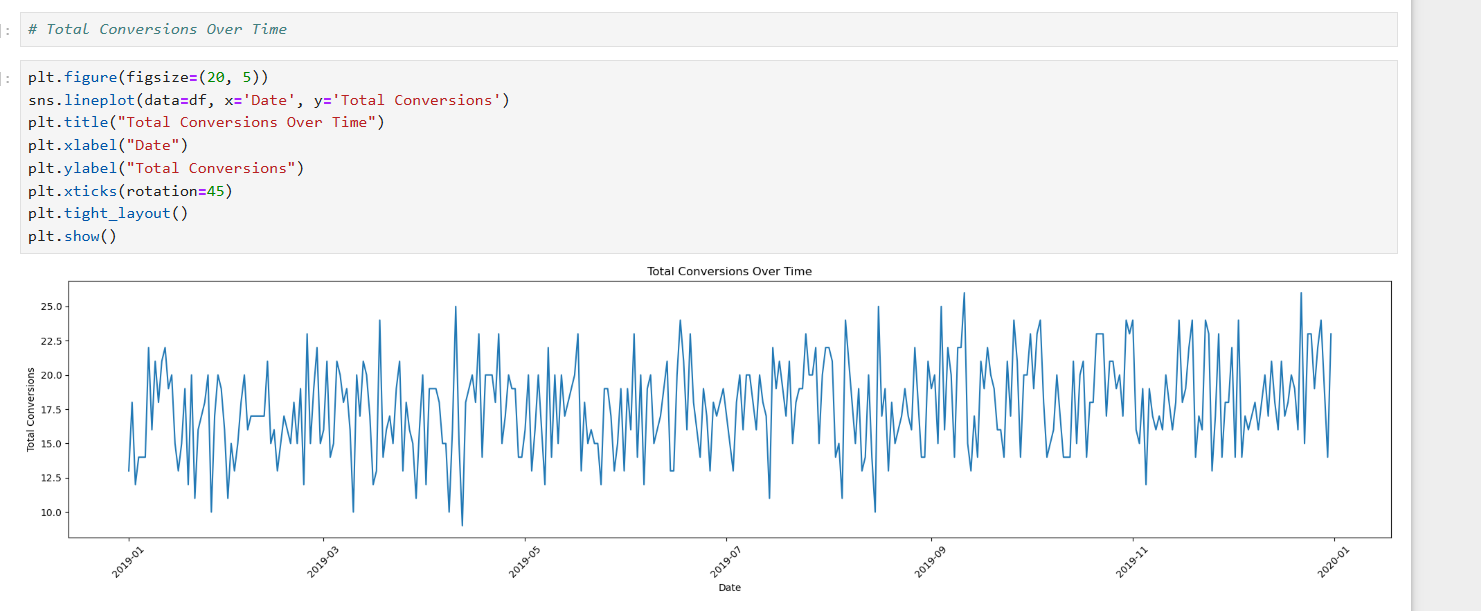
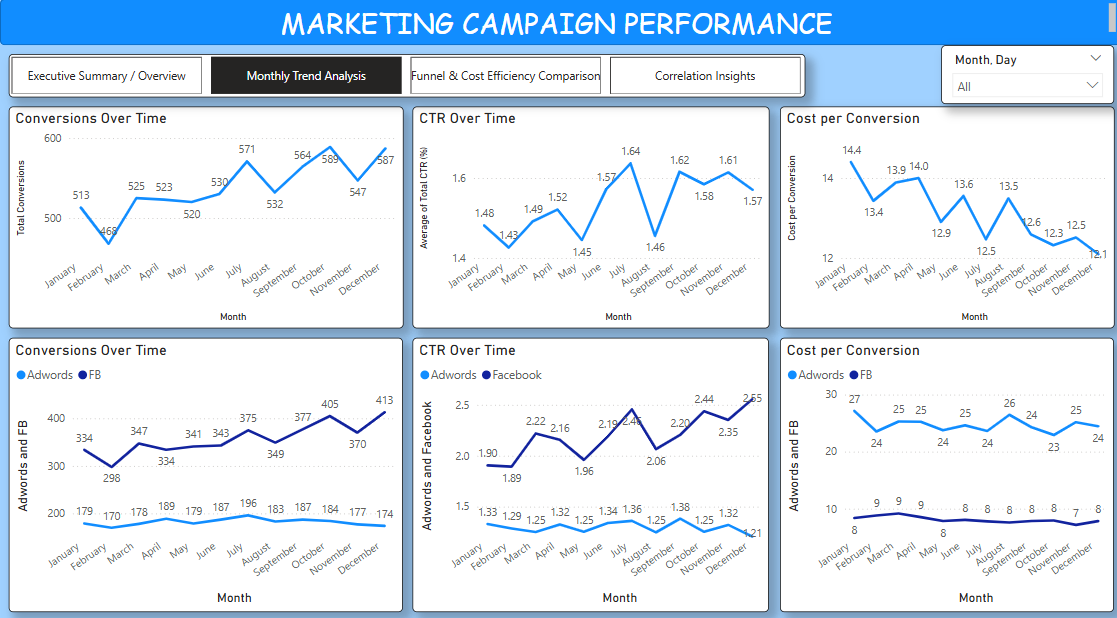
- 📈 Conversions increased over the year by ~16%
- 📉 Cost per conversion dropped from $14.4 to $12.1
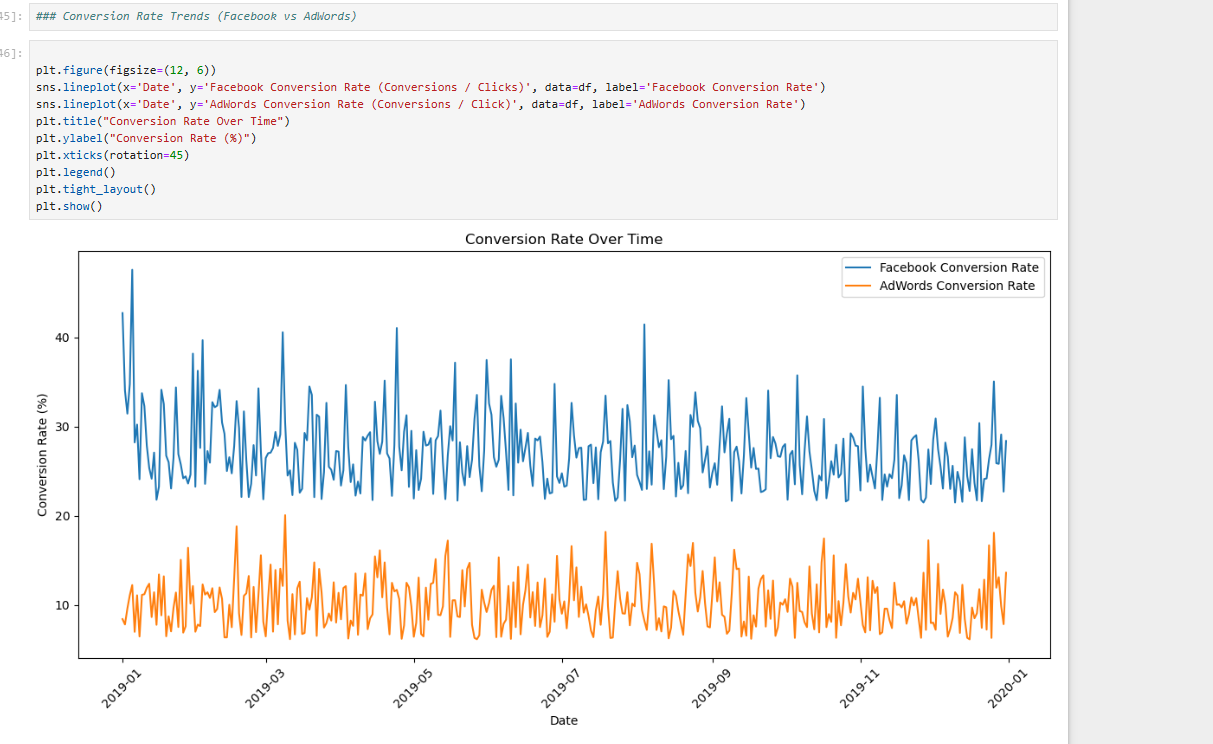
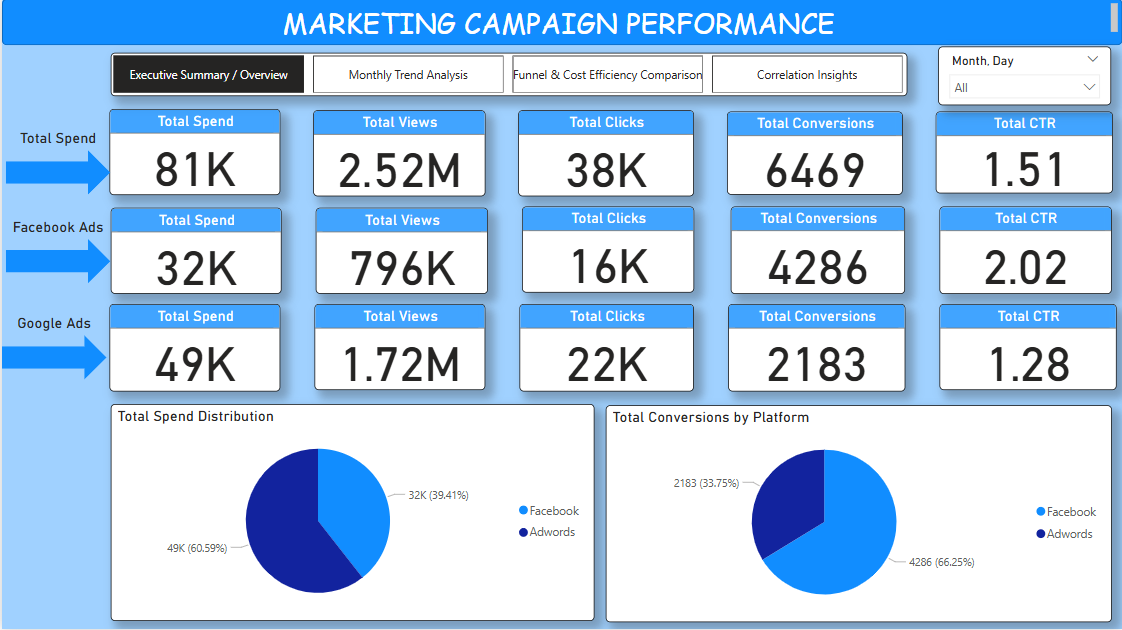
- 🎯 Facebook outperformed AdWords in both CTR and Conversion Rate consistently
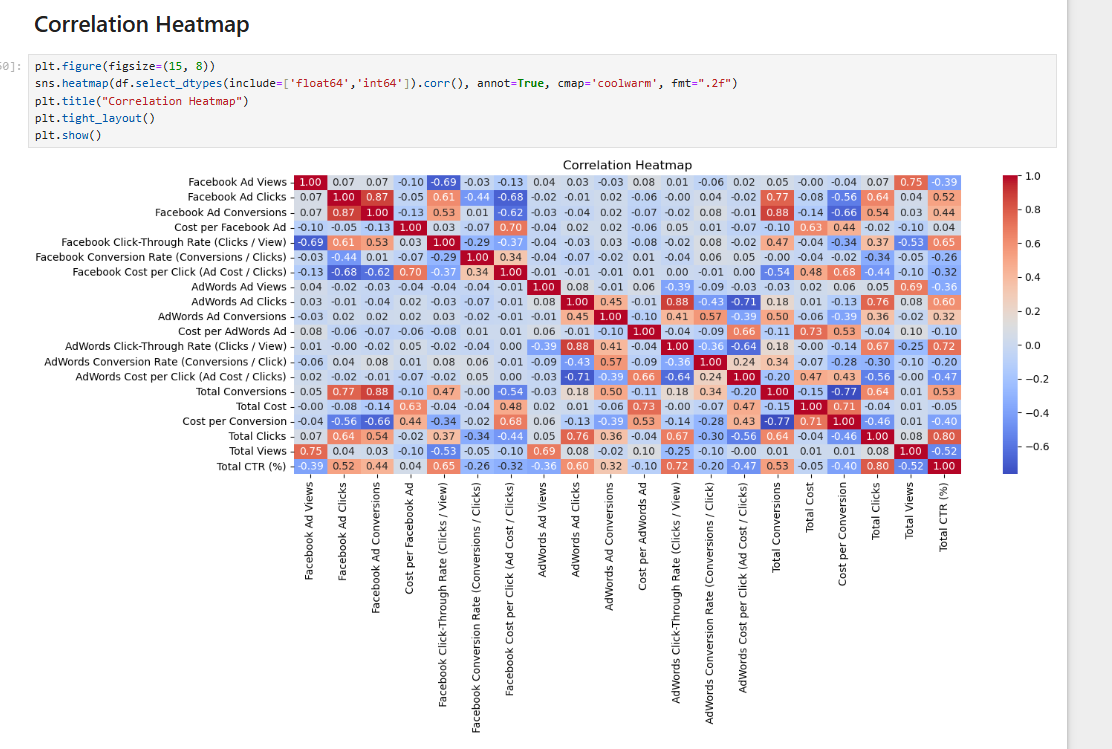
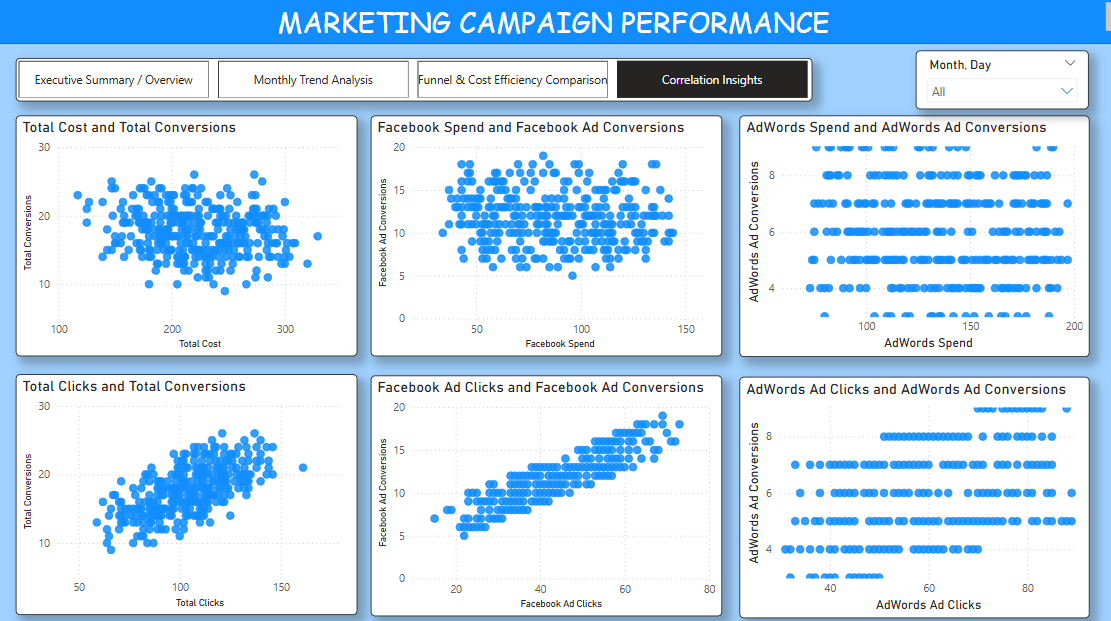
- 📌 Clicks showed a stronger correlation with conversions (0.76) than cost
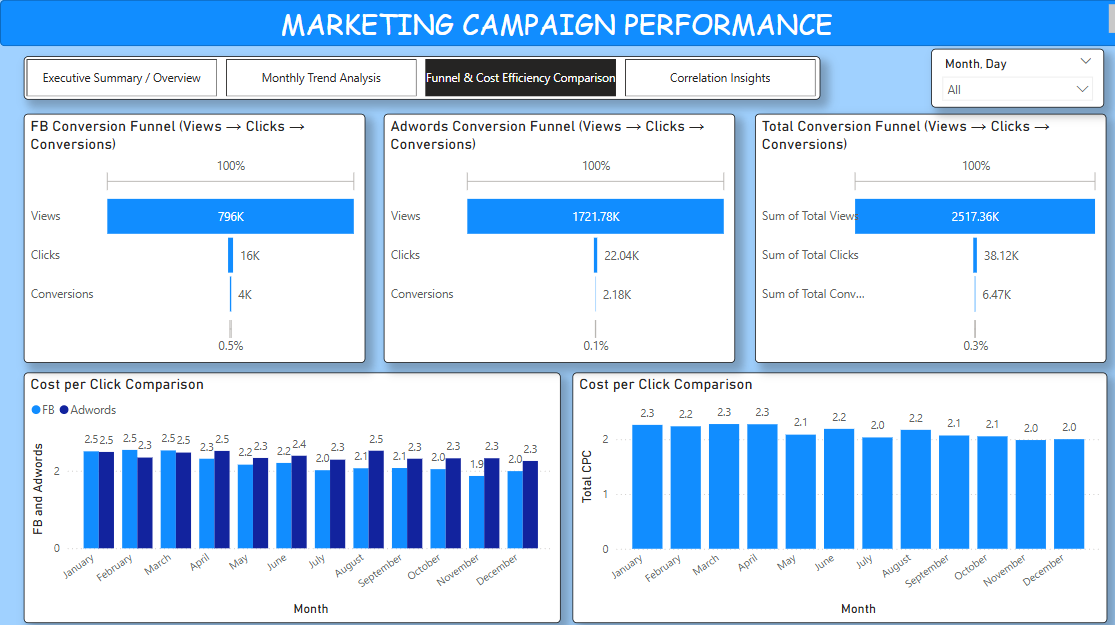
- 🔁 Lower CPC leads to better conversion efficiency
🐍 Python Data Analysis
I used Python to clean the data, perform exploratory data analysis (EDA), and generate insights before building dashboards in Power BI.
✔️ Python Tasks Performed
- Data cleaning: handling nulls, formatting types
- Feature engineering: derived CTR, CPC, Conv. Rate
- Visualizations: Line plots, Correlation heatmaps
- Correlation analysis for identifying drivers of conversions
📈 Example Python Visuals
Conversions Over Time
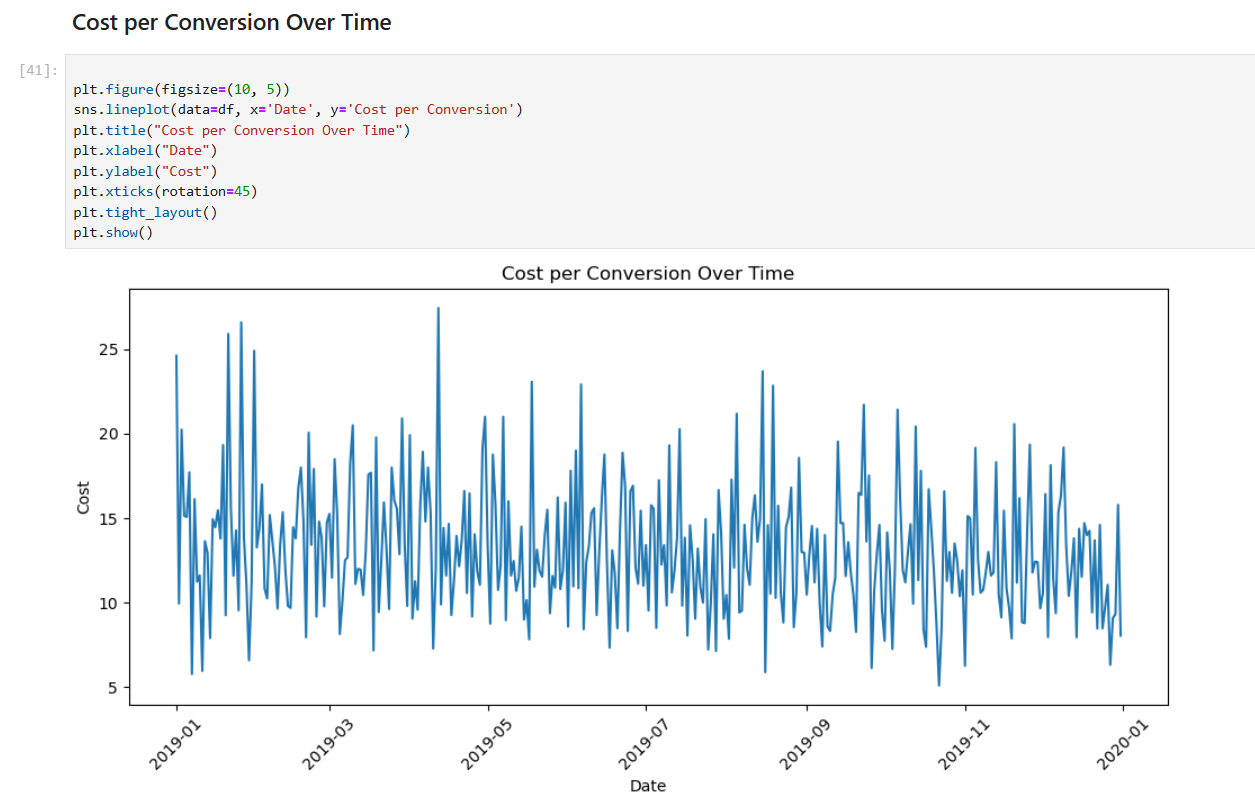
Cost per Conversion Over Time
Click Through Rate (CTR) Over Time
 Over Time.png)
Conversion Rate Over Time
Correlation Heatmap
🧠 Python Insights
- Conversions steadily increased across the months
- Strong correlation between clicks and conversions (0.76)
- Negative correlation between CPC and Conv. Rate (–0.54 to –0.64)
- Facebook showed higher efficiency in cost per conversion
📊 Power BI Dashboards
I used Power BI to visualize the cleaned data and answer key business questions interactively.
📁 Dashboard Pages:
- Executive Summary
- Monthly Trend Analysis
- Funnel & Cost Efficiency
- Correlation Insights
🖼️ Sample Visuals
 📥 Download Power BI Report
Dashboard Video
✅ Final Recommendations
- Allocate more budget to Facebook for better ROI
- Optimize CPC to increase conversion rate
- Monitor cost-efficiency monthly and watch for seasonal patterns
- Prioritize increasing high-quality clicks, not just spend