Project Title
Retail Sales Analysis for Superstore Using Excel
Objective
To analyze customer segments, regional sales performance, product profitability, and sales trends using Excel tools like PivotTables, charts, slicers, and dashboards in order to identify opportunities for business growth.
Project Overview
This Excel-based data analysis project uses Superstore sales data to uncover key business insights across regions, customer segments, product categories, and time periods. It also identifies optimization areas for shipping methods and customer targeting strategies.
Step-by-Step Approach
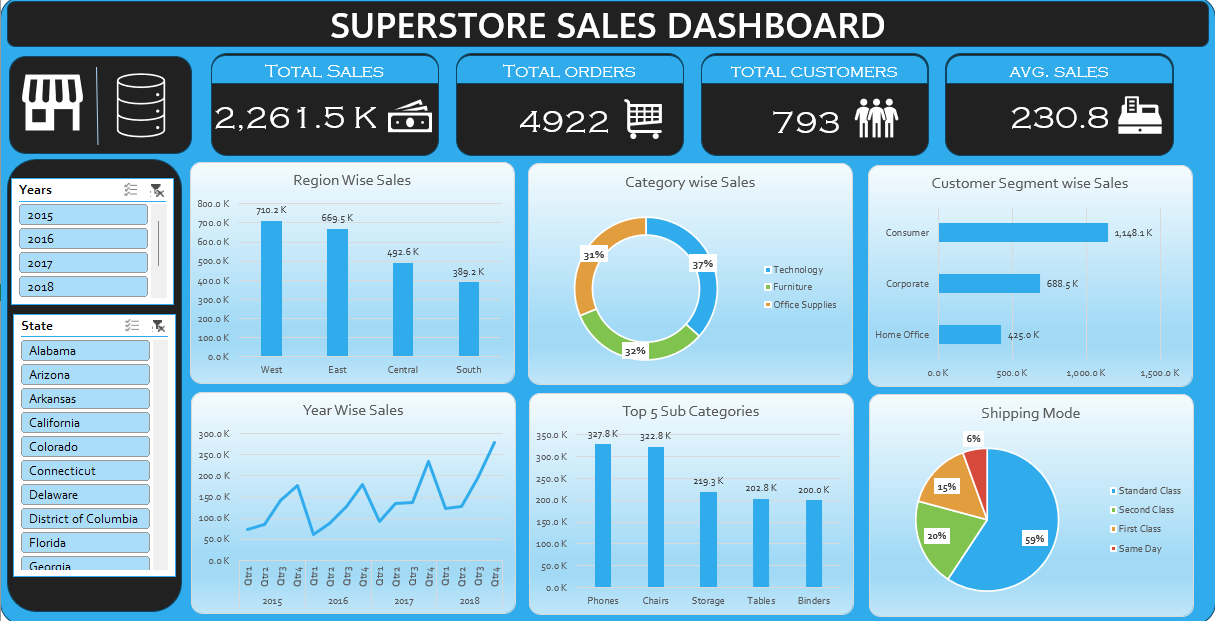
- Step 1: Data Profiling & Cleaning – Handled 9800 rows, replaced 11 blank Postal Codes with "00000", converted formats, extracted Year/Month from Order Date.
- Step 2: KPI Extraction – Found Total Sales, Total Orders, Total Customers, and Average Sales.
- Step 3: Created PivotTables & Charts for each business requirement.
- Step 4: Combined all visuals into a single dashboard sheet in Excel.
Key KPIs
Total Sales: ₹2,261,536.78
Total Orders: 9800
Total Customers: 793
Average Sales per Order: ₹230.77
Business Requirement Answers
1. Regional Performance Analysis
- Top Region by Sales: West
- Underperforming Region: South (Lower sales)
2. Category and Sub-Category Profitability
- Top Category: Technology
- Least Performing Sub-Category: Office Supplies
3. Customer Segmentation
- Top Segment: Consumer
- Potential Growth Segment: Home Office
4. Order Date Trend Analysis
- Peak Months: November & December
- Trend: Upward year-over-year sales pattern
5. Top Customers & Products
- Top 10 Customers: Identified using pivot table sorted by sales
- Top 10 Products: Phones, Binders, Chairs
6. Shipping Mode Optimization
- Most Used Mode: Standard Class
- Insight: Same Day mode has higher order value
Dashboard
All visuals were compiled into a single dashboard sheet with slicers to filter by Region, Year, Segment, and Category.
 Download Excel Dashboard
Dashboard Video
Statistical Summary of Sales
- Mean: ₹230.77
- Median: ₹54.49
- Mode: ₹12.96
- Standard Deviation: ₹626.65
- Skewness: 12.98 (Highly Right Skewed)
- Kurtosis: 304.44 (High peaked distribution)
Tools Used
- Microsoft Excel
- PivotTables, PivotCharts, Slicers
- Conditional Formatting, Formulas (YEAR, MONTH, COUNTIF, SUMIF)
Final Recommendations
- Focus marketing on West and East regions
- Boost campaigns in South region
- Invest more in high-performing categories like Phones
- Promote to Home Office segment
- Prepare for Q4 peak sales early
- Consider premium shipping for high-value orders