E-Commerce Sales & Customer Behavior Analysis using Oracle SQL & Power BI
This project focuses on delivering data-driven insights for a leading Indian e-commerce platform by leveraging Oracle SQL for data cleaning and transformation and Power BI for interactive reporting. The goal was to empower business stakeholders with actionable information on revenue growth, customer behavior, product performance, delivery efficiency, satisfaction trends, and payment preferences.
Tools & Technologies:
Oracle SQL for Data Cleaning, Joins, Business Logic Development
Wrote SQL Queries to answer Business KPIs and Trends
Power BI for Interactive Dashboards & Data Modeling
DAX Measures for Custom KPIs and Performance Metrics
Star Schema Relationships for Scalable Data Modeling
Business Objectives:
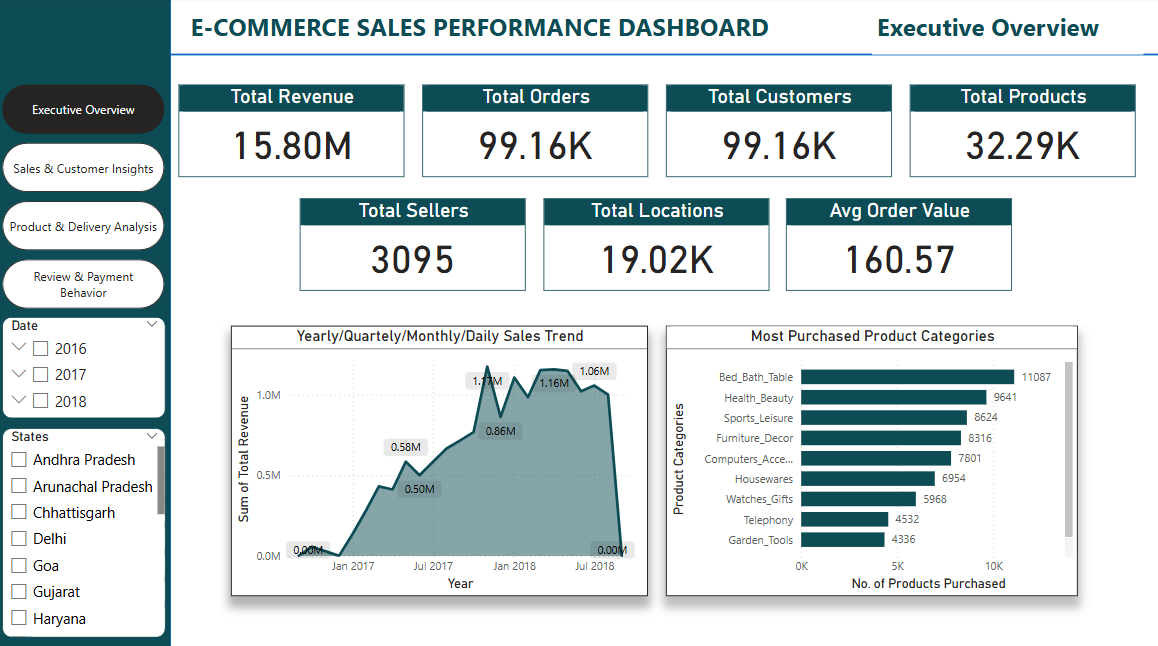
Analyze overall business performance through key KPIs
Track sales trends, peak periods, and revenue contributors
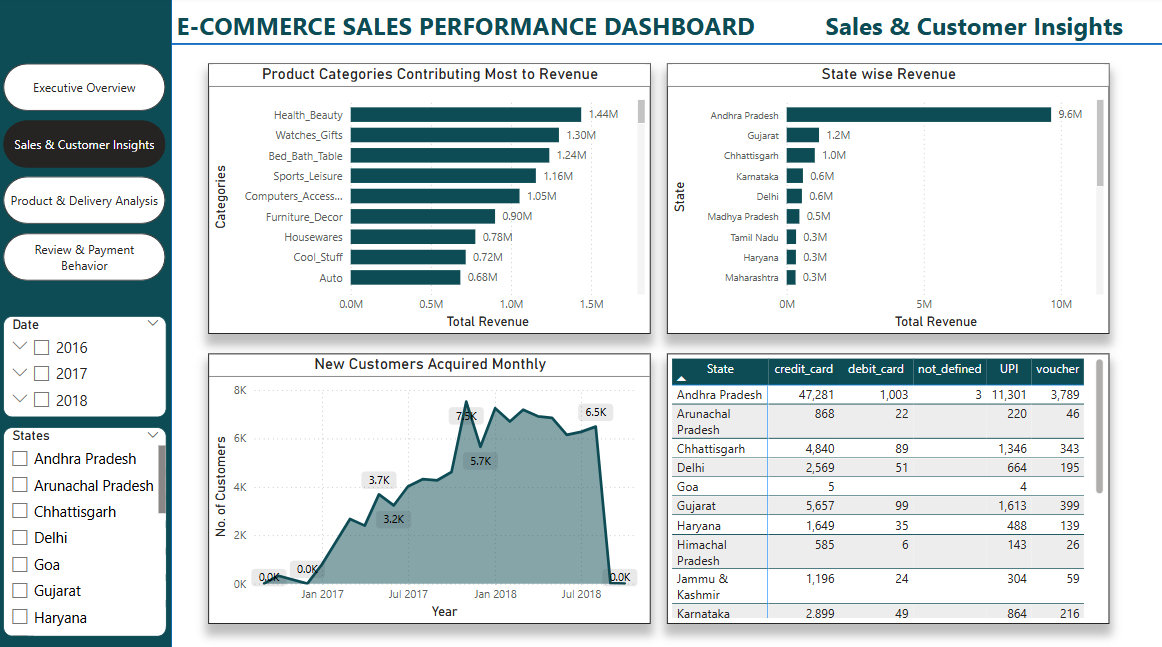
Evaluate customer acquisition, retention, and loyalty
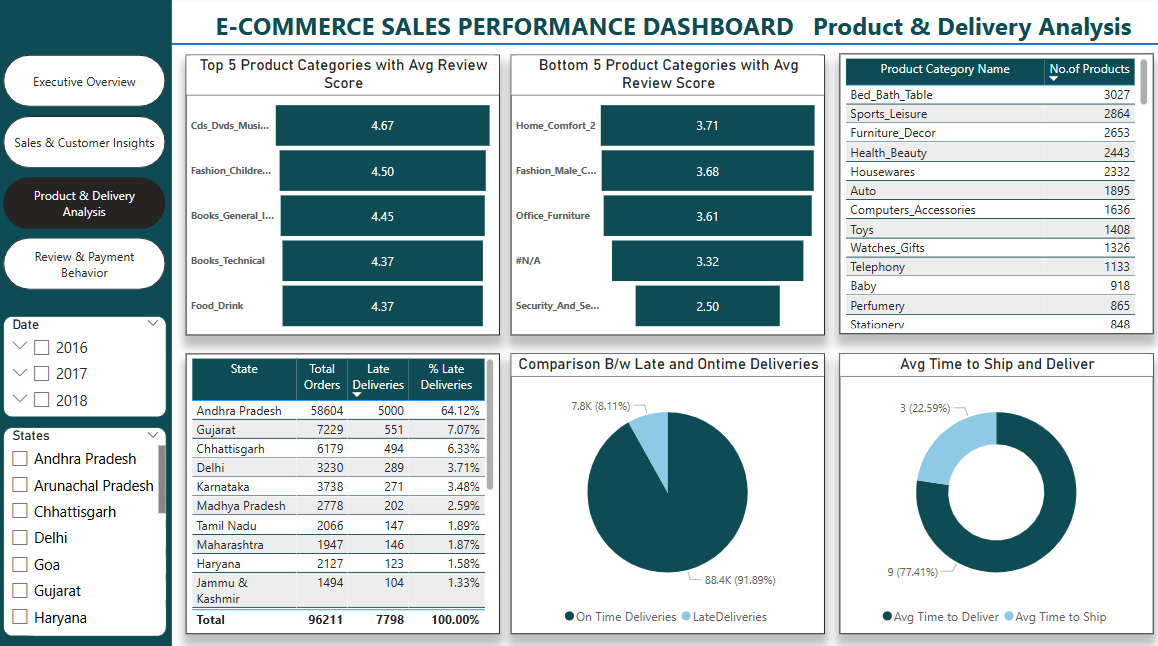
Assess product-level performance, satisfaction, and completeness
Identify order fulfillment delays and optimize delivery timelines
Understand payment preferences and method-level revenue impact
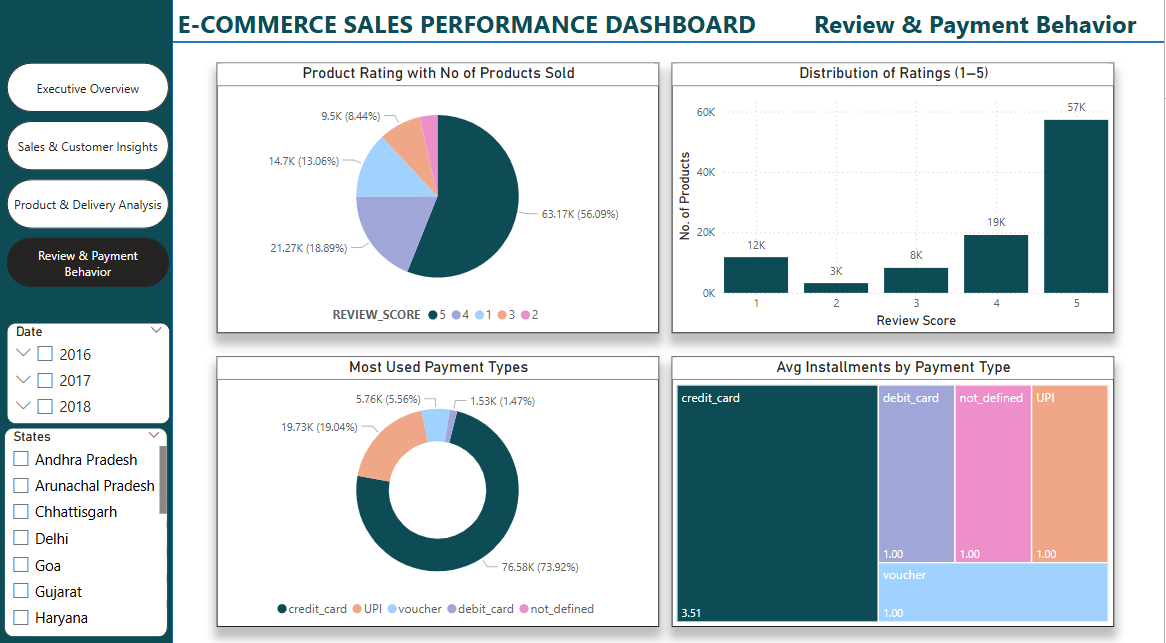
Review & Payment Behavior: Ratings Distribution, Payment Method Usage, Revenue by Payment Type
Business Insights & Recommendations:
Revenue heavily concentrated in a few product categories; diversification recommended
Andhra Pradesh dominates revenue but has the highest late deliveries; operational improvements required
Credit Card is the most used payment method; alternate payment promotions can reduce dependency
Product categories with poor ratings identified for supplier review and quality enhancement
Customer acquisition is consistent, but retention strategies like loyalty programs are needed
SQL Work & Business Logic Development
In this project, I extensively used Oracle SQL for cleaning, transforming, and analyzing the e-commerce dataset before integrating it with Power BI for visualization. The SQL work included:
Data Cleaning: Removed nulls, handled duplicates, standardized inconsistent formats across 8 datasets (Orders, Customers, Products, Payments, Reviews, etc.)
Joins & Data Relationships: Applied INNER JOIN, LEFT JOIN across multiple tables to create consolidated, business-ready datasets
Business Logic Development: Wrote SQL Queries to directly answer business questions such as:
Total Revenue, Orders, Customers, and other KPIs
Monthly Revenue Trends & Peak Sales Periods
Top Product Categories by Revenue
Customer Acquisition & Retention Metrics
Order Fulfillment Delays and Delivery Efficiency
Optimized Queries for Performance: Pre-aggregated data using GROUP BY calculated fields to minimize load on Power BI
Data Validation: Compared and validated Power BI visual outputs with raw SQL query results to ensure data accuracy and report consistency
SQL Query
Revenue by Product Category
SELECT
    p.product_category_name,
    ROUND(SUM(oi.price + oi.freight_value), 2) AS total_revenue
FROM order_items oi
JOIN products p ON oi.product_id = p.product_id
GROUP BY p.product_category_name
ORDER BY total_revenue DESC;
Montly Revenue
SELECT
    TO_CHAR(o.order_purchase_ts, 'YYYY-MM') AS order_month,
    ROUND(SUM(oi.price + oi.freight_value), 2) AS monthly_revenue
FROM orders o
JOIN order_items oi ON o.order_id = oi.order_id
GROUP BY TO_CHAR(o.order_purchase_ts, 'YYYY-MM')
ORDER BY order_month;
Monthly Customer Acquisition
select count(distinct(customer_id)) as customer_count, TO_CHAR(ORDER_PURCHASE_TS, 'YYYY-MM') as Month from orders
group by TO_CHAR(ORDER_PURCHASE_TS, 'YYYY-MM')
order by month;